
Web UI Guide
Start the UI:
Code
This starts the primary FastAPI server.
Open http://127.0.0.1:8000.
On a remote server, use an SSH tunnel first:
Code
Header bar
The header always shows:
- Cases: total number of cases in the registry
- Running: cases currently in
RUNNINGstatus - Converged: cases marked as converged
When a filter is active, each metric shows the filtered count out of the total (e.g., "2 / 5").
The header shows the solver's logo and the browser tab its icon, both provided by the solver adapter; a solver without a logo shows its name as text. Until the dashboard has loaded the solver's description from the server, it shows only the Status, Log Tail and Recent Errors panels and no solver action.
The panels and buttons depend on the solver: each one appears only when the solver provides what it needs (see Adding a new solver). The examples below use code_saturne, which uses all of them.
Settings (gear icon, top right): opens a dialog where you can set the API token (if the server requires authentication) and the auto-refresh rate. The token is saved in the browser (localStorage), so it is asked once per browser and server address.
Status panel
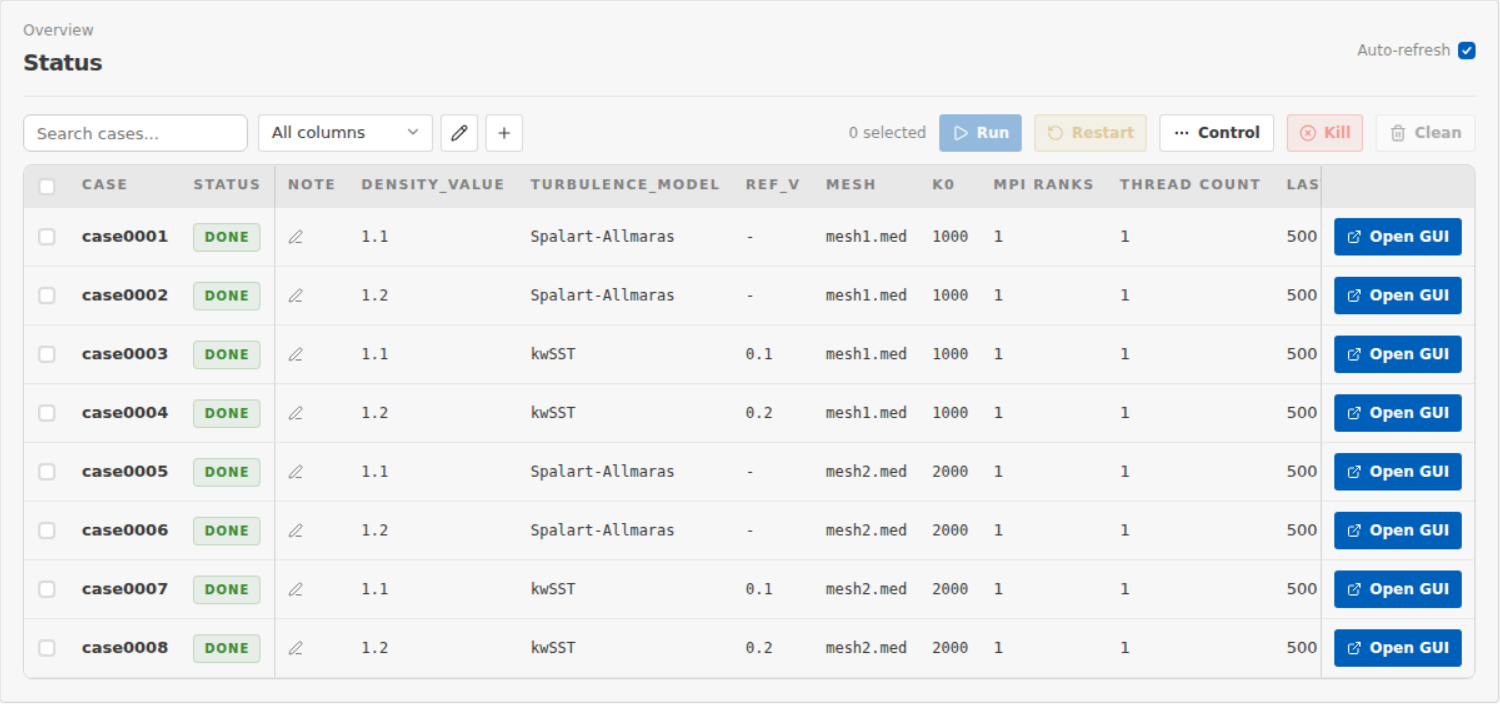
The main table is your campaign dashboard. It refreshes automatically and shows one row per case.
The toolbar provides:
- A search bar to filter cases by name
- An All columns dropdown to toggle which columns are visible
- Filter and sort controls per column
| Column | Meaning |
|---|---|
CASE | Case name |
STATUS | PREPARED, RUNNING, DONE, FAILED |
NOTE | Free-text note you can set per case |
| DOE columns | Your parameter values, one column per DOE variable |
MPI RANKS | Number of MPI ranks used |
THREAD COUNT | Number of OpenMP threads per rank |
LAST ITER | Last completed iteration |
DURATION | Elapsed time since launch |
RESULTS (MB) | Disk usage of the case's results folder |
LAST MODIFIED | Timestamp of the last state change |
When the solver has a GUI (code_saturne does), each row also has an Open GUI button that opens it on the case's setup file.
Selecting cases
- Click a row to select it
Ctrl/Cmd + clickto add to selectionShift + clickto select a rangeCtrl/Cmd + Ato select allArrow Up/Downto navigate rows (Shift + Arrowfor range selection)Spaceto toggle selection (Shift + Spacefor range)Escto deselect
Bulk actions
With one or more cases selected, the action buttons activate:
Run: launch the selected cases (PREPARED, DONE, or FAILED). A popup
asks for MPI Ranks (n), OMP Threads (nt) and Max Parallel (left
empty, local runs are capped to cpu_count // (n * nt) at once, a scheduler receives every selected case).
Restart (when the solver supports it): continue finished cases. A popup offers the solver's restart modes and asks for a value when the mode takes one. With code_saturne:
Additional iterations: add N more iterations beyond the checkpointAdditional physical time: run for that much more physical time
Restart from picks the run to restart from (one case selected); by default csauto uses the latest run that has a checkpoint and computes the absolute target value for you.
Control (when the solver supports live control): a menu of the actions the solver offers for running cases. Actions that take a value ask for it; the others ask for confirmation. With code_saturne:
- Stop gracefully: finish the current time step, write a checkpoint and exit. Unlike Kill, no process is signaled and no restart is needed.
- Extend: raise the time step limit so the case keeps going. Asks for the number of additional time steps (repeated extends stack correctly).
- Write a checkpoint: at the next time step, without stopping the run. Plots mark restarts (new runs launched from a checkpoint), not in-place checkpoints.
- Flush logs and plots: write logs and probe files to disk now. It does not affect the simulation.
Kill: stop the selected running cases at once. Works for local processes, containers and Slurm jobs. Prefer a graceful stop when the solver offers one: Kill discards in-flight work.
Clean: delete old run folders and/or shorten heavy logs for the selected
finished cases. A popup lets you keep the latest N runs, delete them all, or,
with a single case selected, pick the run folders to keep or delete (run
folders are named per case). Clean only deletes the folders the solver reports
as runs (code_saturne: each RESU/<run>; code_aster: RESU itself, its single
run) and never touches running or queued cases; a notice lists the ones it
skipped. A case whose runs were all deleted returns to PREPARED. Clean
also shortens logs larger than 50 MB to their last 50 MB and removes the
docker container id file (.csauto.cid).
Context menu on finished cases
Right-click a DONE or FAILED row to:
- Mark Converged: set convergence label to
converged - Mark Not Converged: set to
not converged - Clear Mark: remove the convergence label
Residuals Plot
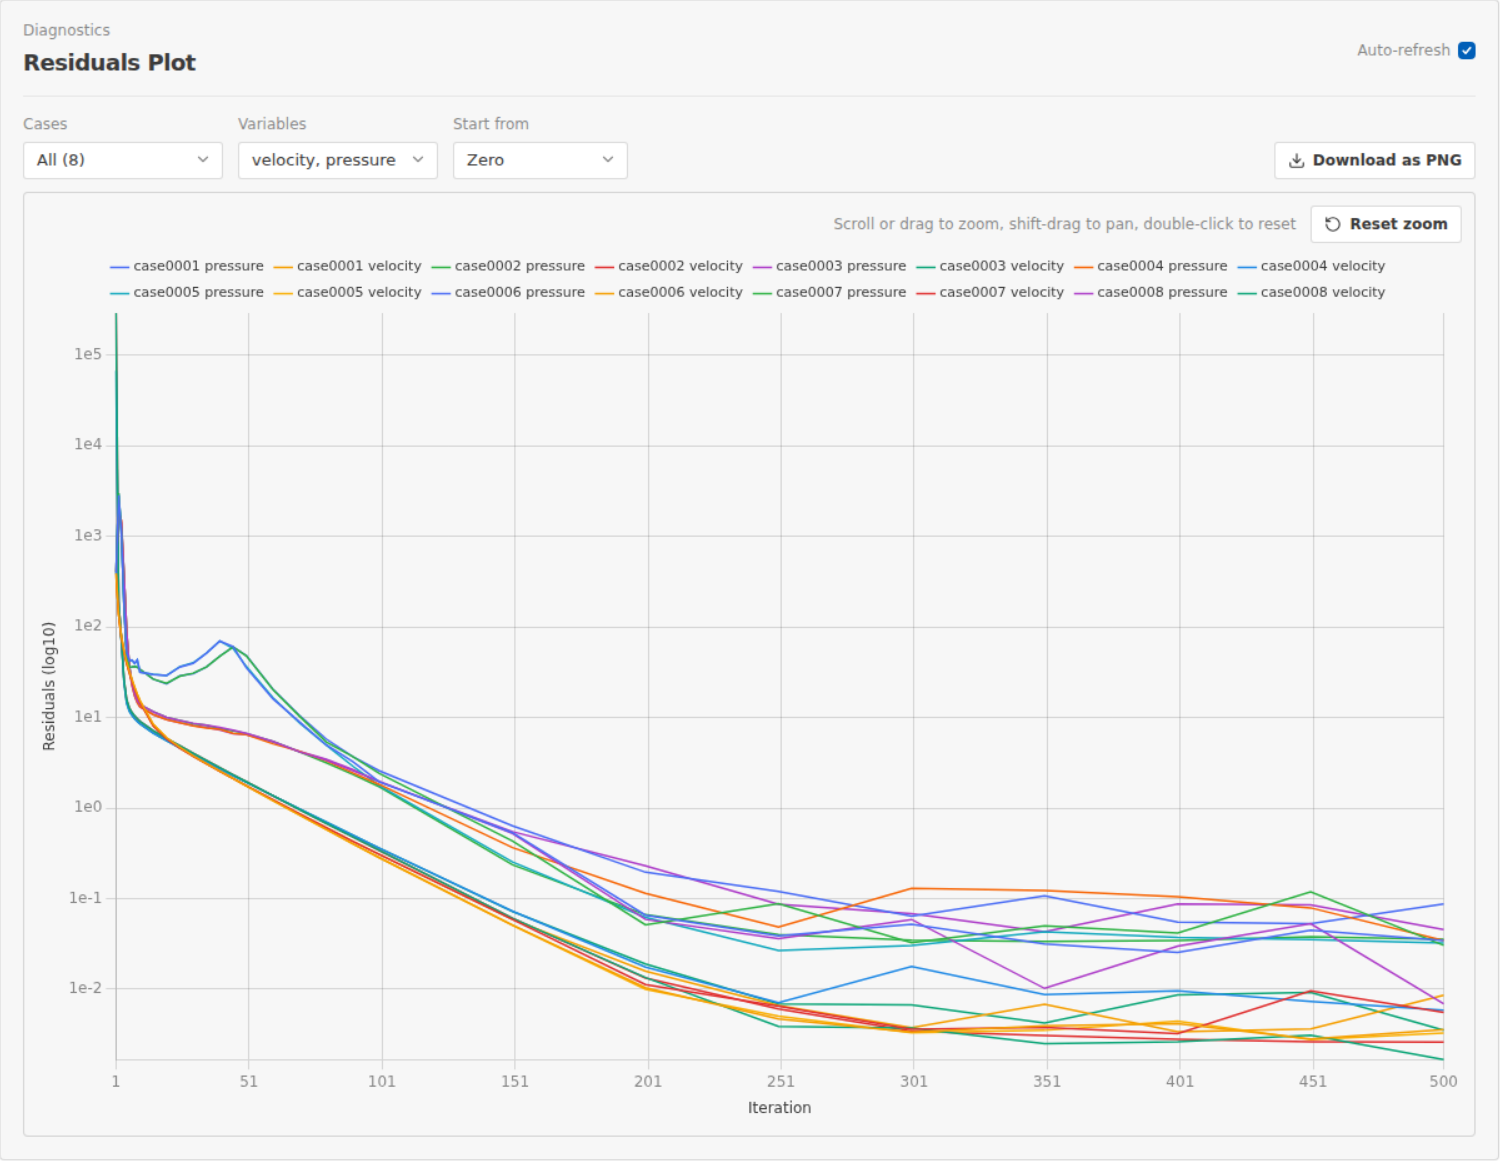
Use this panel to inspect solver convergence for one or more cases.
- Select one or more cases from the Cases dropdown
- Choose the Variables to plot (e.g., velocity, pressure)
- Choose the Start from point:
Zero: plot from the very beginning, including the case's previous runsRestart start: start from the last restart checkpoint iterationCustom: manually set the minimum iteration to display
- The chart updates automatically when auto-refresh is enabled
The SVG chart shows residuals vs. iteration number. Multiple cases are overlaid on the same chart for comparison. A vertical dashed line marks restart points.
Click Download as PNG to export the chart.
Probes and Profiles
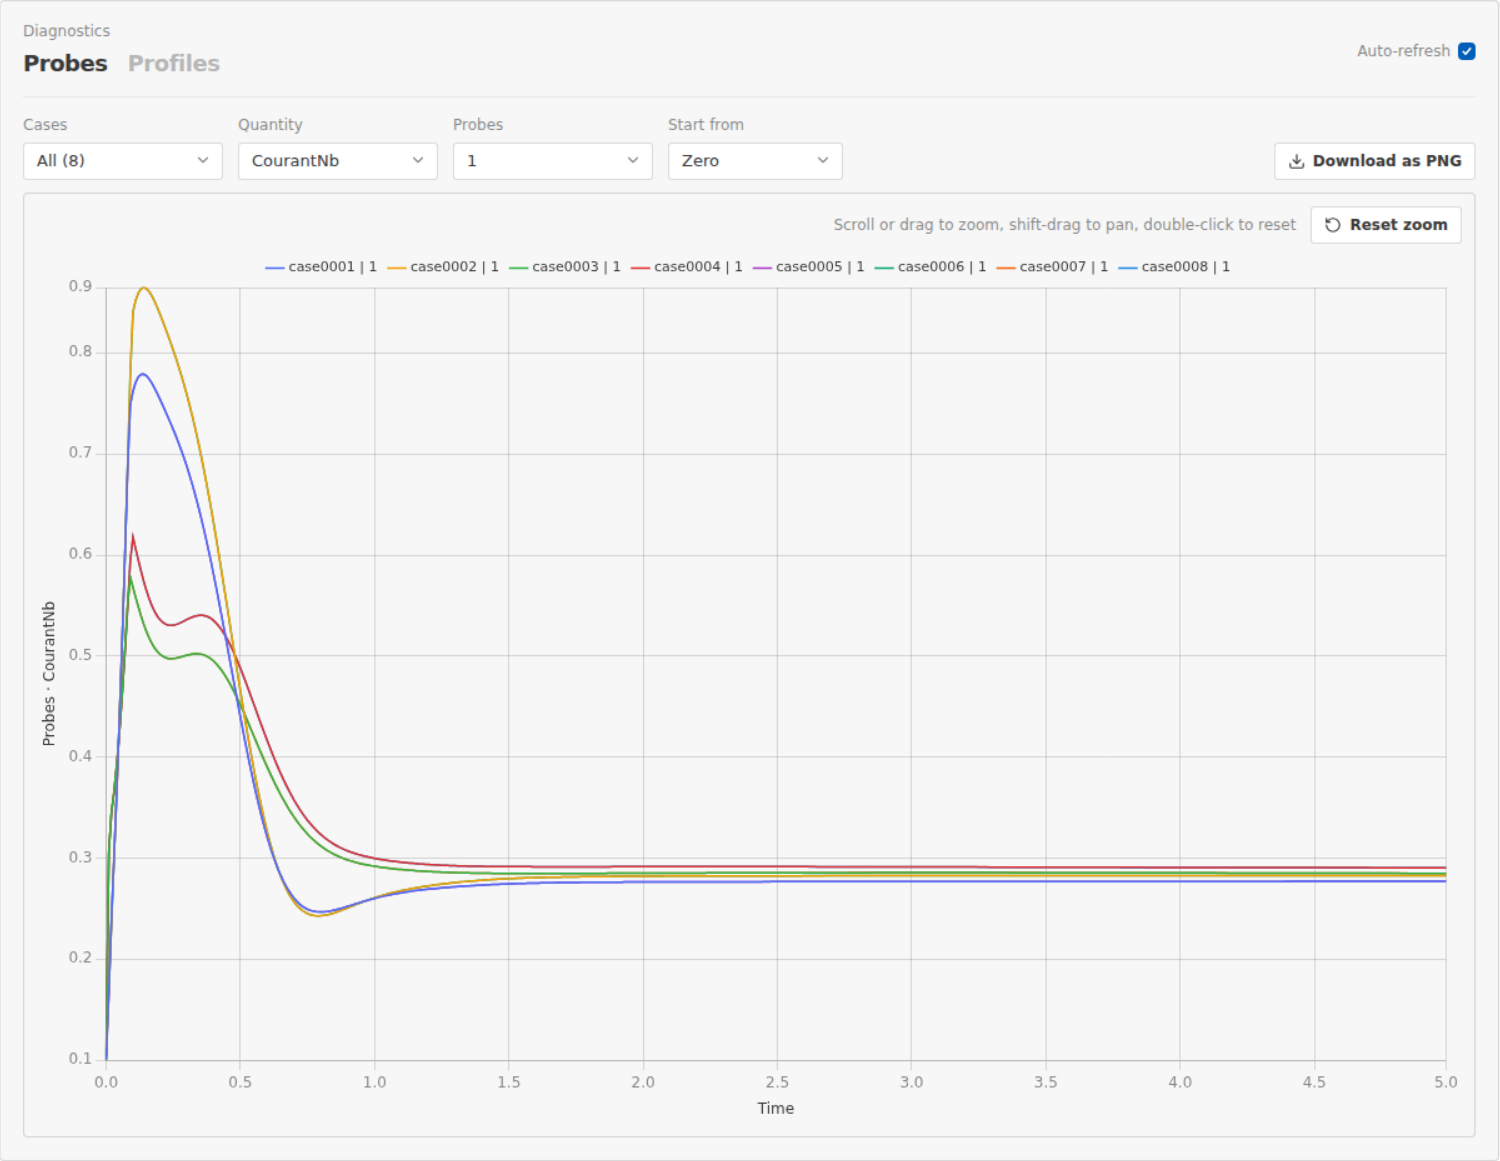
This panel has two tabs, Probes and Profiles, each shown when the case
has such files (with code_saturne, in its latest RESU/<run>).
Probes tab
With code_saturne: RESU/<run>/monitoring/*.csv.
- Select one or more cases from the Cases dropdown
- Choose the Quantity (probe file to read, e.g., CourantNb)
- Select one or more Probes (data columns within that file)
- Choose the Start from point (
Zero,Restart start, orCustom) - The chart plots the selected probes over time
The spatial coordinates of each selected probe are displayed below the controls.
Profiles tab
With code_saturne: RESU/<run>/profiles/*.csv.
- Select one or more cases from the Cases dropdown
- Choose the Profile file
- Choose the X axis column (e.g., abscissa, distance)
- Select one or more Values to plot against the X axis
- Choose the Start from point (
Zero,Restart start, orCustom)
Click Download as PNG to export either chart.
Timing Snapshot
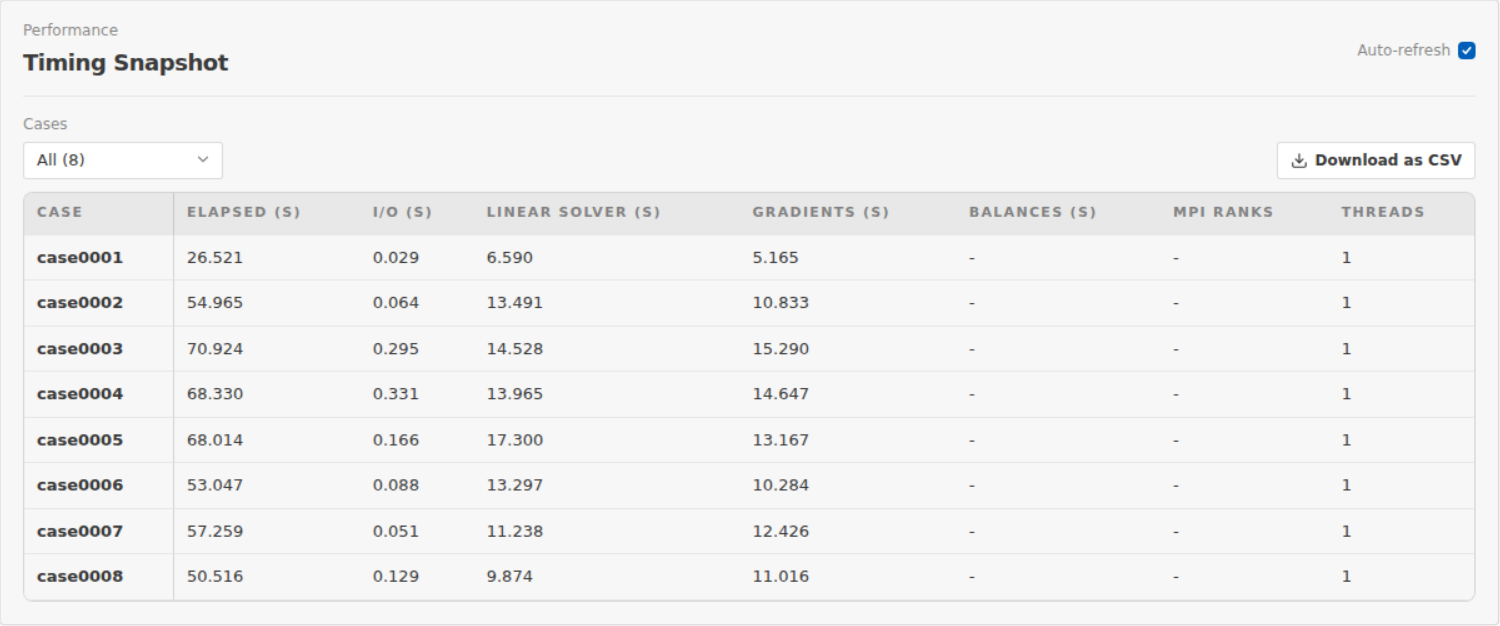
Displays performance metrics for one or more cases in a comparison table.
Select cases from the Cases dropdown. The column set is declared by the solver adapter; with code_saturne the table shows:
| Column | Meaning |
|---|---|
CASE | Case name |
ELAPSED (S) | Total elapsed wall-clock time |
I/O (S) | Time spent on file I/O |
LINEAR SOLVER (S) | Time spent in the linear solver |
GRADIENTS (S) | Time spent computing gradients |
BALANCES (S) | Time spent on balance computations |
MPI RANKS | Number of MPI ranks used |
THREADS | Number of OpenMP threads per rank |
Click Download as CSV to export the table.
Side-by-Side Comparison
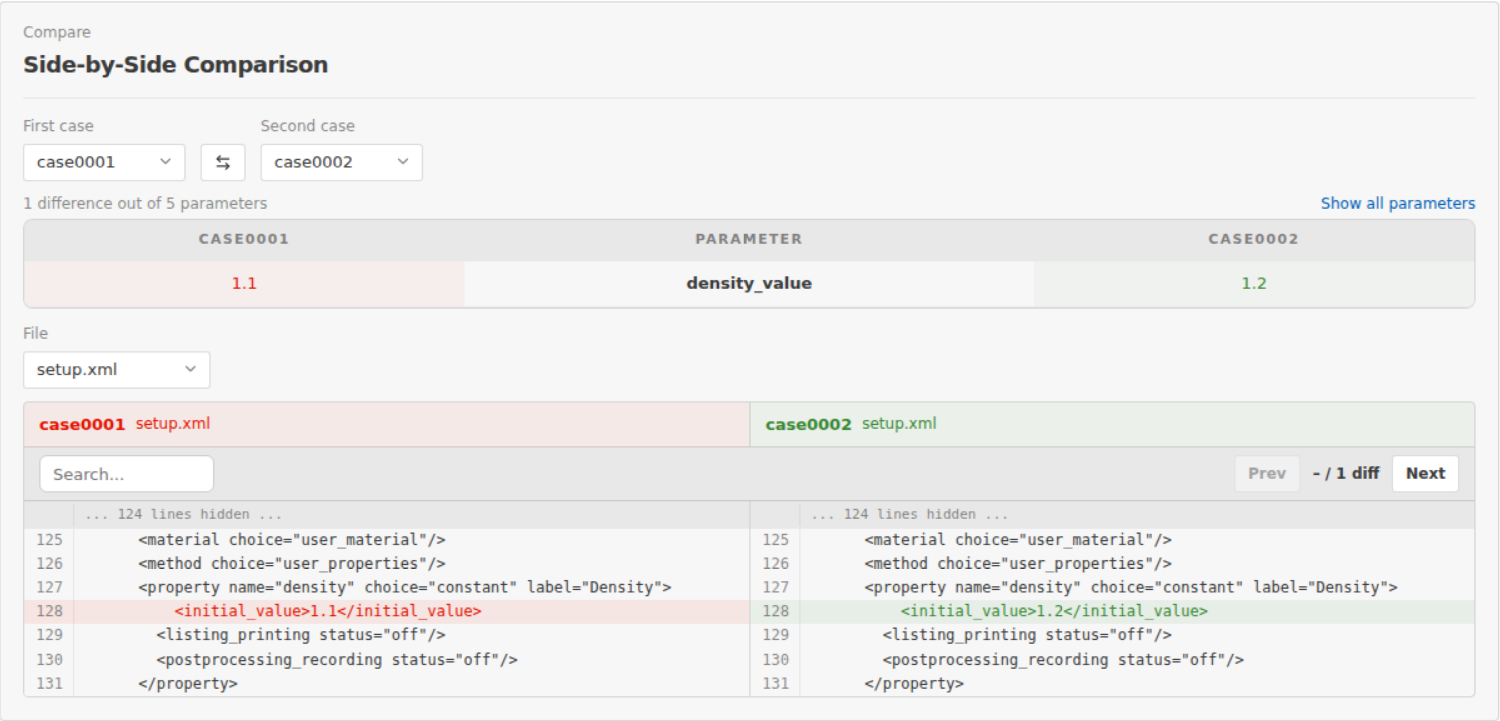
Compare two cases side by side: parameters and file contents.
Steps:
- Select the First case and Second case from the dropdowns (use the swap button to switch them)
- The panel shows a parameter diff summary (e.g., "1 difference out of 3 parameters"). Click Show all parameters to see matching parameters too
- Choose a File to compare: the list comes from the solver, and its first
entry is the default (code_saturne:
setup.xml,doe_row.csv,run_solver.log,performance.log; code_aster: the export file anddoe_row.csv) - Use the Search bar to filter lines
The output shows a side-by-side diff with line numbers. Differing lines are highlighted for quick identification.
Log Tail
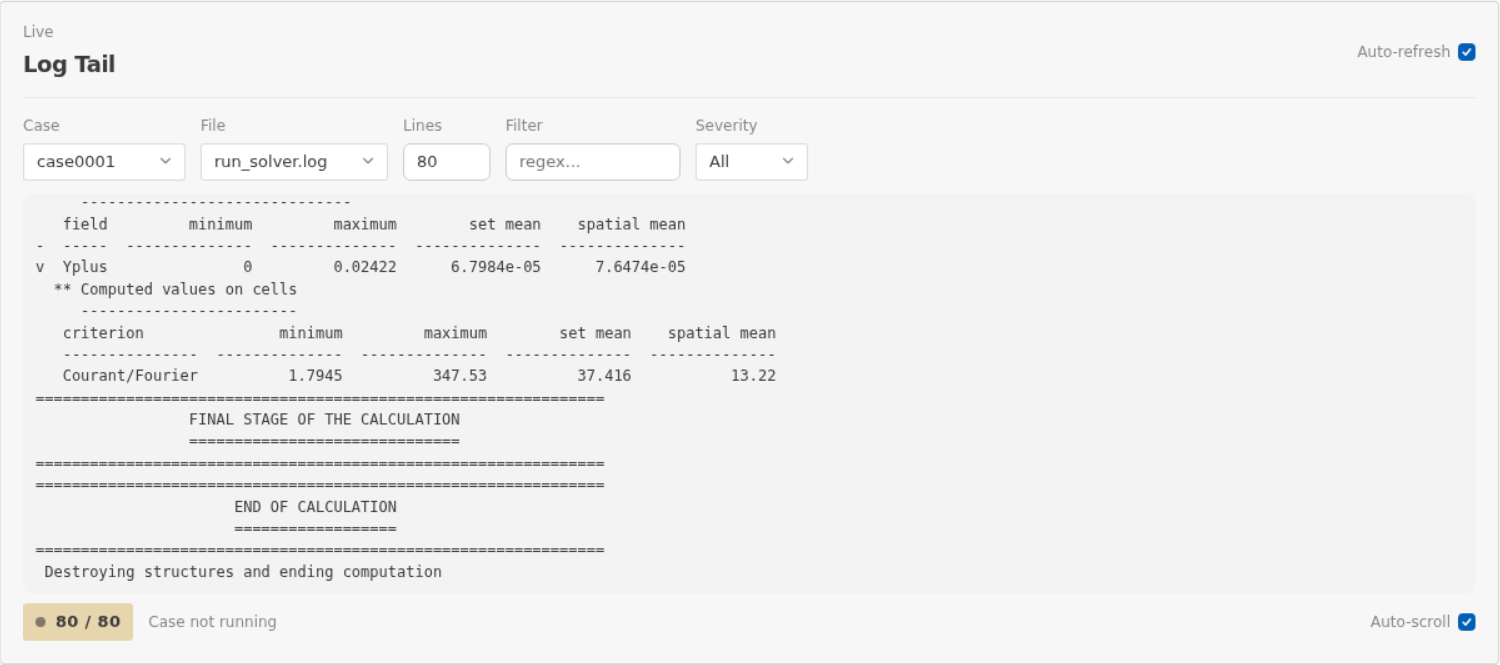
Stream the end of a case log file, similar to tail -f.
The File list puts the solver's main logs first, then csauto.stdout and
csauto.stderr (the console output of the launch, available for every solver)
and the other *.log files of the latest run. The first file is selected by
default.
| Situation | File to use |
|---|---|
| Solver running, check progress | the solver's main log (code_saturne: run_solver.log; code_aster: csauto.stdout) |
| Launch issue (the solver did not start) | csauto.stderr / csauto.stdout |
| Slurm submission issue | csauto.stdout |
Controls:
- Case: select the case
- File: choose the log file
- Lines: number of lines to display (default 80)
- Filter: regex filter to match specific lines
- Severity: filter by
Error,WarnorAll. Lines are coloured with the same patterns Recent Errors uses for this solver
The bottom bar shows:
- A line count indicator (filtered lines / total, e.g., "80 / 80")
- A status indicator: pulsing red dot when the case is running, grey dot when stopped
- A Pause / Resume button (available when the case is running)
- An Auto-scroll toggle to keep the view at the bottom as new lines arrive
Recent Errors
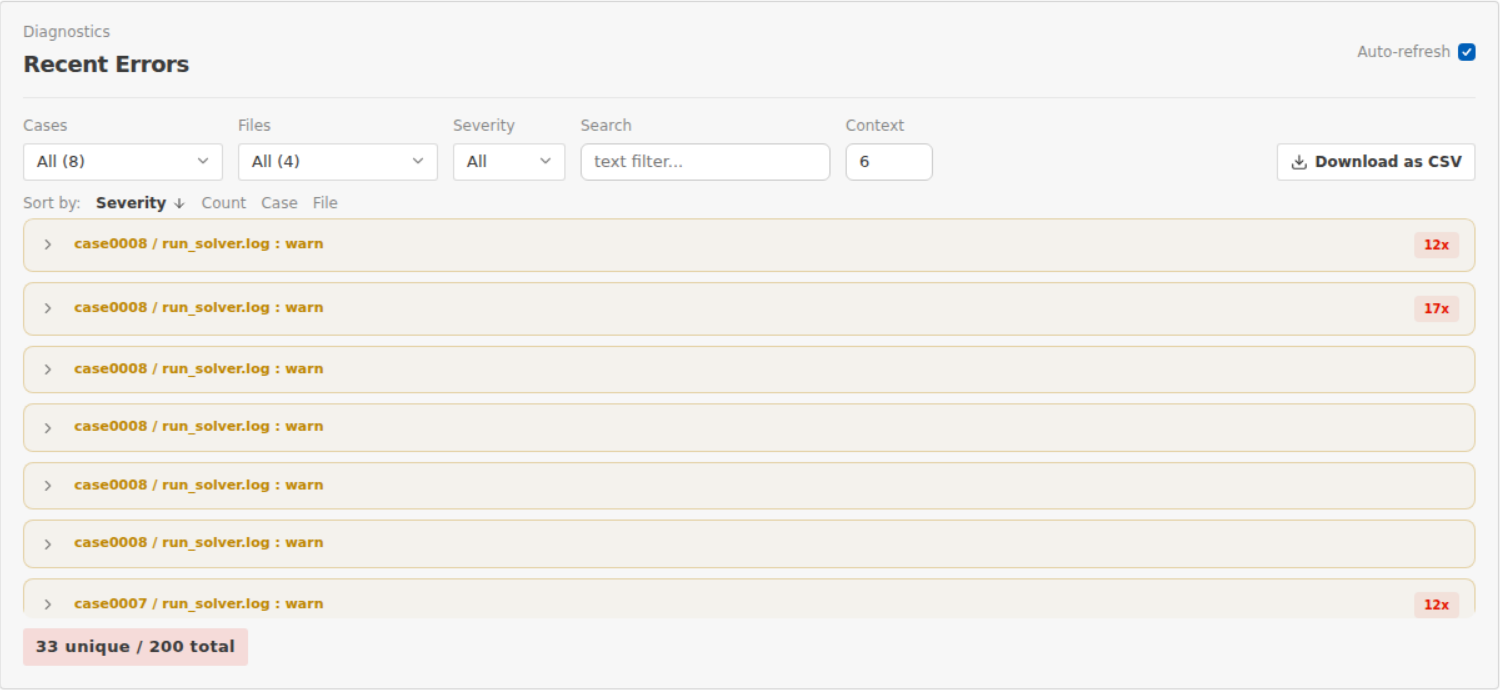
Scan log files for errors, warnings, and informational messages.
When to use: a case finished with FAILED, or you see unexpected behavior and
want a quick summary of what went wrong without reading the full log.
Controls:
- Cases: select which cases to scan
- Files: select which log files to include (multi-select; the list comes
from the solver; with code_saturne:
csauto.stderr,run_solver.log,listing,csauto.stdout) - Severity:
All,Error,Warn - Search: plain-text search within matched lines
- Context: how many lines before and after each hit to display (default 6)
Results are deduplicated by fingerprint and grouped by case and file, with expandable sections. Each section shows matched lines highlighted in context. Errors not seen in the previous scan are tagged with a NEW badge. The summary bar shows the count of unique and total matches (e.g., "12 unique / 64 total").
Use Sort by to reorder results by Severity, Count, Case, or File.
Click Download as CSV to export the results.
Serving on a public host
If you need to expose the UI beyond localhost (e.g., to colleagues), configure an API token first:
Code
Then serve with:
Code
Without a token, csauto refuses to bind to a public address.
Users accessing the UI must click the Settings gear icon and enter the token once per browser.